One Billion Row Challenge
I recently attempted the One Billion Row Challenge (1BRC) using the Zig programming language and was able to optimize my program to execute in 1.12 seconds. In this blog post, I will discuss my methodology, the optimizations, and my takeaways after attempting this challenge.
What is the One Billion Row Challenge?
1BRC originated in January 2023 as a casual programming challenge in the data processing community to test the performance limits of Java. The task is given a synthetic dataset of 1 billion rows, each consisting of a weather station and a temperature, compute the minimum, maximum, and mean temperature for each station. Then, print the results to stdout in alphabetical order. The challenge hence spread across other language communities and continues as a fun activity for recreational programmers.
Below is a snippet taken from the dataset.
Hamburg;12.0
Bulawayo;8.9
Palembang;38.8
Hamburg;-34.2
The challenge laid out a list of rules and constraints about the inputs. For this blog post, here are the constraints with the most relevance. You can find the full list of rules here .
- There are at most 10,000 unique weather stations.
- A station name has a max length of 100 bytes.
- Temperatures range between -99.0 to 99.0 (inclusive).
Methodology
My methodology was inspired by Amdahl’s Law . The law states…
the overall performance improvement gained by optimizing a single part of a system is limited by the fraction of time that the improved part is actually used.
Formally it is described as.
S = 1 / ((1 - p) + (p / s))
Where S is overall speedup, p is a proportion of program execution, and s is the speedup of that proportion.
This distills down to if you optimize the bottleneck of your system, it will give you the greatest performance improvements.
To identify choke points, I utilized Apple’s profiler that ships with XCode, Instruments . It samples a program’s stack trace every 1 millisecond to provide estimates on the total time spent in each function. This is made possible because Zig emits DWARF compliant debug symbols so Instruments can map back to the source function names. It also can track total CPU cycles and hardware performance counters . These are super helpful in identifying where in your processor pipeline your code is causing bottlenecks. Not to mention it also has a beautiful UI. The tool is incredibly powerful and there is a lot it can do but, diving into Instruments could be the topic of a different blog post.
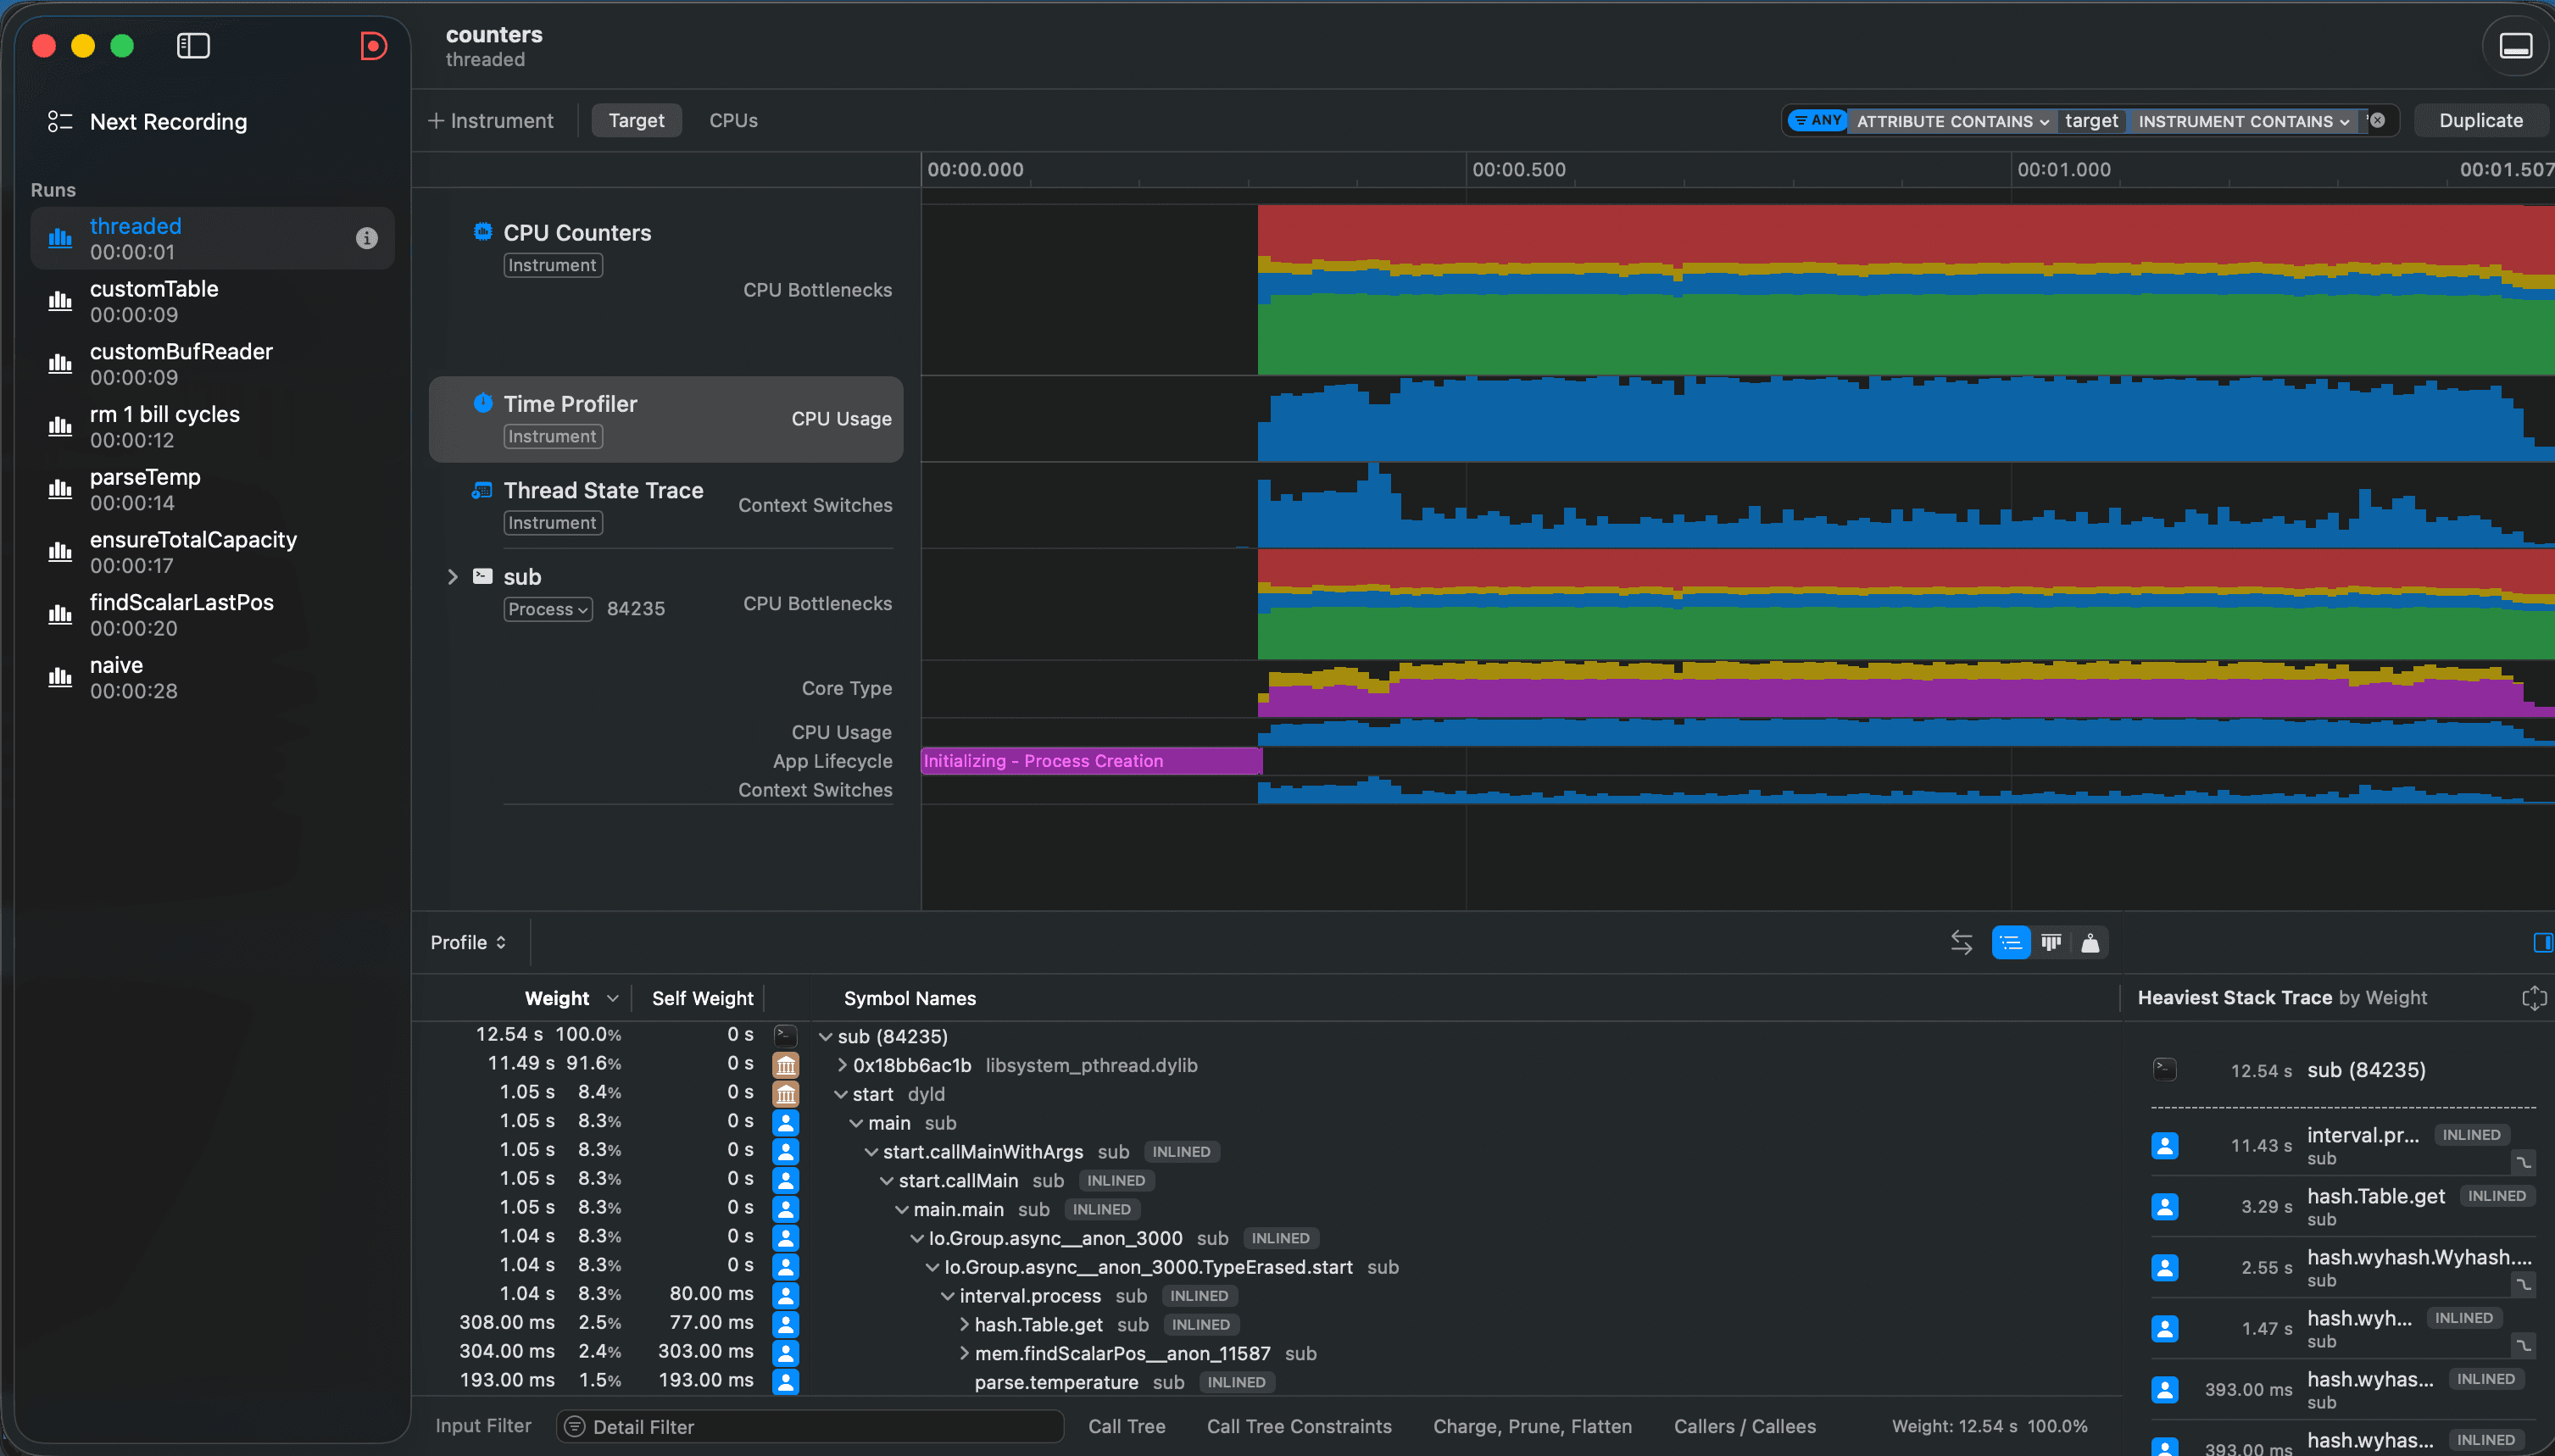
Additionally, I used hyperfine as the tool to measure execution time. I configured it to have 3 warm up runs and 10 measured executions which were averaged together.

Optimizations
Below is each optimization I added chronologically and its performance impact.
| N | Optimization | Execution Time (s) | Speedup |
|---|---|---|---|
| - | Java baseline | 141.597 | |
| 0 | Zig implementation | 27.998 | 5.057 |
| 1 | Find semicolon in reverse | 19.172 | 1.460 |
| 2 | Static hash map allocation | 16.044 | 1.195 |
| 3 | Custom temperature parser | 13.231 | 1.213 |
| 4 | Custom buffered reader | 9.681 | 1.367 |
| 5 | Custom hash map | 9.277 | 1.044 |
| 6 | Multi-threaded | 1.118 | 8.138 |
I did not cover all details of my implementation, only details about specific parts of the code partaining to each optimization. So, if you have not attempted this challenge before, I’d encourage you to stop now and think how you would naively implement a solution to have some grounding on the topic.
Implement it in Zig!
Just by implementing a simple solution with Zig and setting the flag
-Doptimize=ReleaseFast, I was able to get a 5x speedup from the provided Java
baseline. Way to go Zig and LLVM teams!
Finding the semicolon
The initial implementation parsed each station and temperature by taking a
slice of each line in the
file. Followed by linearly searching for a semicolon from the beginning of each
slice. This call to findScalar accounted for 33.0% of the execution time.
while (try reader.takeDelimiter('\n')) |line| {
    const dim = std.mem.findScalar(u8, line, ';').?;
By switching to searching from the end of the slice and starting 3 bytes back it dropped the proportion of execution time down to 5.5%. That dropped our execution time from 28 to 19 seconds.
while (try reader.takeDelimiter('\n')) |line| {
    // Max temperature string lengh is 5
    // Min temperature string lengh is 3
    // Vientiane;-26.8
    //            ^
    // Palembang;6.8
    //          ^
    const dim = findScalarLastPos(u8, line, line.len - 3, ';').?;
Preallocate the hash map buffer
The next bottleneck was the getOrPut method on the hash map. In total it
accounted for 32.7% of program execution. Drilling in further, an internal
method, isTombstone, accounted for 13.7%. After perusing through the
implementation a bit, I gathered just enough context to make an educated guess
isTombstone is part of resizing the internal buffer. So, I preallocated the
hash map to support 10,000 entries. This dropped getOrPut to 20.4% of the
execution time and isTombstone to 0.4%! Dropping total execution time to 16
seconds.
try map.ensureTotalCapacity(gpa, 10_000);Custom temperature parser
Now, parseFloat became the bottleneck with a execution proportion of 31.3%. I
wrote a float parser tailored to our temperature range while also switching to
use integers before converting them back to floats. This dropped the proportion
of time spent parsing temperatures down to 3.6% and total execution time to 13
seconds.
fn parseTemp(temp: []const u8) i16 {
    var result: i16 = 0;
    var i = temp.len - 1;

    const ones = charToDigit(temp[i]);
    result = ones;

    i -= 2; // Skip '.'

    const tens = charToDigit(temp[i]);
    result += tens * 10;

    // Edge Cases:
    // 1. -10.0
    // 2. -0.0
    // 3. 10.0
    // 4. 0.0

    if (temp.len == 5) {
        result += charToDigit(temp[1]) * 100;
        result *= -1;
    } else if (temp.len == 4) {
        if (temp[0] == '-') {
            result *= -1;
        } else {
            result += charToDigit(temp[0]) * 100;
        }
    }

    return result;
}
Custom buffered reader
The next bottleneck was the buffered reader (I was dreading this the most). It
accounted for 32.8% of total execution time. It took me multiple implementation
attempts but I finally landed on a custom implementation that out performed the
Zig standard library. I found measuring the new one was hard because it was
baked into the main function which drowns it out. However, this dropped
total execution time down to 9.7 seconds.
var off: usize = 0;
while (try pread(file, &buf, buf.len, off)) |n| {
    var i: usize = 0;
    while (i < n) {
        const newline = std.mem.findScalarPos(u8, &buf, i, '\n') orelse break;

        // ...

        i = newline + 1;

        // ...
    }
    off += i;
}
Custom hash map
Then it was back to the hash map. It was back to taking up 32.7% of the program.
I reasoned a custom implementation would need less code than a generic one
provided by the standard library. Therefore, less code meant less cycles and
less execution time. I used the same hash function as the standard library
StringHashMap, Wyhash, and used linear probing. This dropped the proportion
of time spent in the getOrPut function to 19.1% and execution time to 9.3
seconds.
The guts of the implementation were in the getOrPut function.
fn getOrPut(self: Table, key: []const u8) *Entry {
    const hash = std.hash.Wyhash.hash(42, key);
    var i = hash % self.table.len;
    while (!self.table[i].isEmpty()) : (i = (i + 1) % self.table.len) {
        if (self.table[i].hash == hash) return &self.table[i];
    }
    self.table[i].hash = hash;
    return &self.table[i];
}
Unleash the beast
Finally, I implemented multi-threading. I used a MapReduce like technique where I split my input evenly bounded on newlines and each worker had their own hash map it populated. I matched the number of workers to the number of CPU cores on my machine which was 12. After all workers finished, the maps were reduced into the final result.
I measured the proportion of execution time for parsing and populating the maps
with Zig’s monotonic clock (std.Io.Clock.awake.now(io)). However, the sections
outside of processing all 1 billion rows are only nanoseconds. So, roughly
speaking, this processing stage accounts for 99.99% of execution time and
continues to be the bulk of the program after the added parallelism.
var group: Io.Group = .init;
for (intervals, tables) |int, table| {
    group.async(io, interval.process, .{ gpa, file, table, int });
}
try group.await(io);
I was able to use the new Zig 0.16 Io interface which was very clean!
Unsuccessful Optimizations
Custom findScalarPos
In the final program, findScalarPos continues to be a large bottleneck. I took
a stab at implementing my own by combining SIMD instructions with loop unrolling
but, it only drove up the CPU backend bottleneck counters and slowed down
execution time. I concluded the Zig standard library has one hellava
implementation
so, shout out to them!
One shared hash map
Before I went with a MapReduce implementation for the multi-threaded approach, I tried using one hash map with a mutex. However, this resulted in poor performance and it also caused a lot bugs (skill issue I know).
Different hashing functions
I tried a lot of different hashing functions however, Wyhash is really hard
to beat and nothing I tried was faster.
Future Improvements
I belive I have reached the point where improvements can only be made at an architectural level. I still have a couple of ideas on how to break the 1 second barrier however, I’m going to hang up my hat. At least until another day.
Metal API
Finding the indexes for semicolons and newlines takes up the largest chunk of the time. I also think it could contribute to roughly a third of the time the CPU makes a branch misprediction.

While pondering ways to reduce branching, I wondered if a GPU could help build a list of indexes that could then be used to parse out weather station names and temperatures. With the indexes known a head of time, the number of branch mispredictions would theoretically go down resulting in less machine clears.
Deepen the pipeline, and add streaming
Right now data does not start reducing until all jobs are finished. I wonder if the performance would improve if data was streamed from one part of the pipeline to another and more steps in the pipeline were created (like the idea above).
Takeaways
Less code is faster.
Just by implementing my own versions of standard library functions, I was able to remove extra code unnecessary for my application and ultimately reduced the number of cycles in the hot path. This is apparent in the bespoke buffered reader, hash map, and temperature parser.
Use static allocations
If you know the constraints of you application, then you can allocate all of the memory you need up front. This removes memory allocation from your hot path to speed up execution. An example of this in practice can be seen with TigerBeetle and their TigerStyle philosophy.
Measure first, then optimize.
When I initially started, I thought I’d be bottlenecked by the disk. However,
the syscalls to pread
where only a sliver of the execution time and therefore I never touched it.
Additionally, I thought there would be some need to optimize the final stage where the stations are sorted and the hash maps are reduced. However, that section of code remain basically the same as the baseline implementation.
Math For Nerds
Now equipped with empirical speedup data, I wondered how it compared to the theoretical speedup that Amdhal’s Law predicts. For optimizations where I could measure the proportion of execution time before and after, here are the theoretical speedups compared to the actual results.
| N | Optimization | Theoretical Speedup (S) | Actual Speedup (S’) |
|---|---|---|---|
| 1 | Find semicolon in reverse | 1.529 | 1.460 |
| 2 | Static allocation | 1.657 | 1.195 |
| 3 | Custom temperature parser | 1.485 | 1.213 |
| 5 | Custom hash map | 1.665 | 1.044 |
It is clear Amdhal’s law over-predicts speedup potential here. I reason the profiler sample rate has an impact on this gap. However, I am curious about the reader’s thoughts on this discrepancy.
Conclusion
This challenge was really fun and rewarding! Thank you Gunnar Morling for creating such a valuable learning experience and fostering a community of great performance engineers. There were times when it was hard, but thankfully I didn’t give up and it was so satisfying to see the execution time drop. I am relatively new to performance engineering but, I felt this was the perfect way to get my feet wet.
Furthermore, Zig is an awesome programming language and I’m going to continue to invest in learning it. It is a simple language but, it also gives you so much power in how you can customize the build system, write expressive typing, and compute values at comptime. It has been such a joy to work with.
You can find all the code here ,
including the code for each iteration by checking out the branches prefixed with
N-.
Machine
CPU: Apple M4 Pro
RAM: 48 GB
MacOS: 26.6.2 (25G83)
Zig: 0.16.0
AI Disclaimer
I used AI chat bots for assistance for learning Zig. However, all code for the challenge was written by hand and I used my ideas for optimizations. After Claude started to pick up I was doing 1BRC, I specifically prompted to not give optimization hints which it did not. Additionally this blog was written without the help of AI.